InfluxDB for IoT devices
The number of connected devices is growing every year, but most of them don’t expose a public API (pretty sad).
Some work is needed to extract access all their secrets, which is a whole other story.
Currently, I just display the data on a screen, but having stored data for some machine learning and analysis would be great.
But where to store and evaluate the data? InfluxDB to the rescue!
Searching for a tool that just saves all the data devices produce every day was pretty hard. There are a lot of IoT platforms available today, but some of them cost money and have way too many features for my use case, while others do not provide visualization and analysis out-of-the-box or can’t be self-hosted.
InfluxDB is just a database optimized for time series data, but there is a whole stack of tools for collecting, analyzing, displaying, and processing data called TICK.
The most important components for me are the InfluxDB for storage, Chronograf for visualization and Telegraf for data
collection.
Kapacitor, the last element of the stack is used for triggering alerts and processing data, which may come
in handy later on.
Installation
I like to organize all my services in containers using Docker. Here is a simple docker-compose file that fires up all parts of the TICK stack.
1
2
3
4
5
6
7
8
9
10
11
12
13
14
15
16
17
18
19
20
21
22
23
24
25
26
27
28
29
30
31
32
33
34
35
36
37
38
39
40
41
42
43
version: "3"
services:
    influxdb:
      image: influxdb
      container_name: influxdb
      restart: always
      ports:
        - "8086:8086"
      volumes:
        - $PWD/influxdb:/var/lib/influxdb
      networks:
        - influx
    telegraf:
      image: telegraf
      container_name: telegraf
      restart: always
      networks:
        - influx
      volumes:
        - $PWD/telegraf.conf:/etc/telegraf/telegraf.conf:ro
    chronograf:
      image: chronograf
      container_name: chronograf
      restart: always
      ports:
        - "8888:8888"
      networks:
        - influx
      volumes:
        - $PWD/chronograf:/var/lib/chronograf
    kapacitor:
      image: kapacitor
      container_name: kapacitor
      restart: always
      networks:
        - influx
      volumes:
        - $PWD/kapacitor.conf:/etc/kapacitor/kapacitor.conf:ro
      environment:
        - TZ=Europe/Berlin
        - KAPACITOR_INFLUXDB_0_URLS_0=http://influxdb:8086
networks:
    influx:
Customize the volume and port bindings to your liking.
Then just execute docker-compose -d up to start all services in the background.
Data collection
Now we can retrieve some data from our IoT devices using the first part of the TICK stack, Telegraf. There is a multitude of input plugins available from the official repository .
I will mostly use the HTTP plugin, because my data is already being preprocessed by other containers for use in other
services. Maybe I will change that and make Influx the hub for all my data needs later on.
But for now, this setup makes consuming data very simple.
To consume a HTTP endpoints providing JSON data, I set up my telegraf.conf like so:
1
2
3
4
5
6
7
8
9
10
11
12
13
14
15
16
17
18
19
20
21
22
23
24
25
26
27
28
29
[global_tags]
  dc = "iot_nd"

[agent]
  interval = "10s"

# OUTPUTS
[[outputs.influxdb]]
  url = "http://influxdb:8086" # required.
  database = "iot" # required.
  precision = "s"

# INPUTS
[[inputs.http]]
  urls = ["http://192.168.188.20:9094/info"]
  data_format = "json"
  name_override = "wallbox"

[[inputs.http]]
  urls = ["http://192.168.188.20:9091/data"]
  data_format = "json"
  name_override = "pv"

[[inputs.http]]
  urls = ["http://192.168.188.20:9095/cmi_data"]
  interval = "90s"
  name_override = "heating_system"
  data_format = "json"
  json_query = "data"
Documentation for the HTTP Plugin is available here.
influxdb is the URL for the InfluxDB, because Docker automatically resolves hostnames as specified by the container
name to the correct IP in the network.
Telegraf will write new data in a database called iot and will query data in an interval of 10s,
except for the last input, where data will only be queried every 90 seconds.
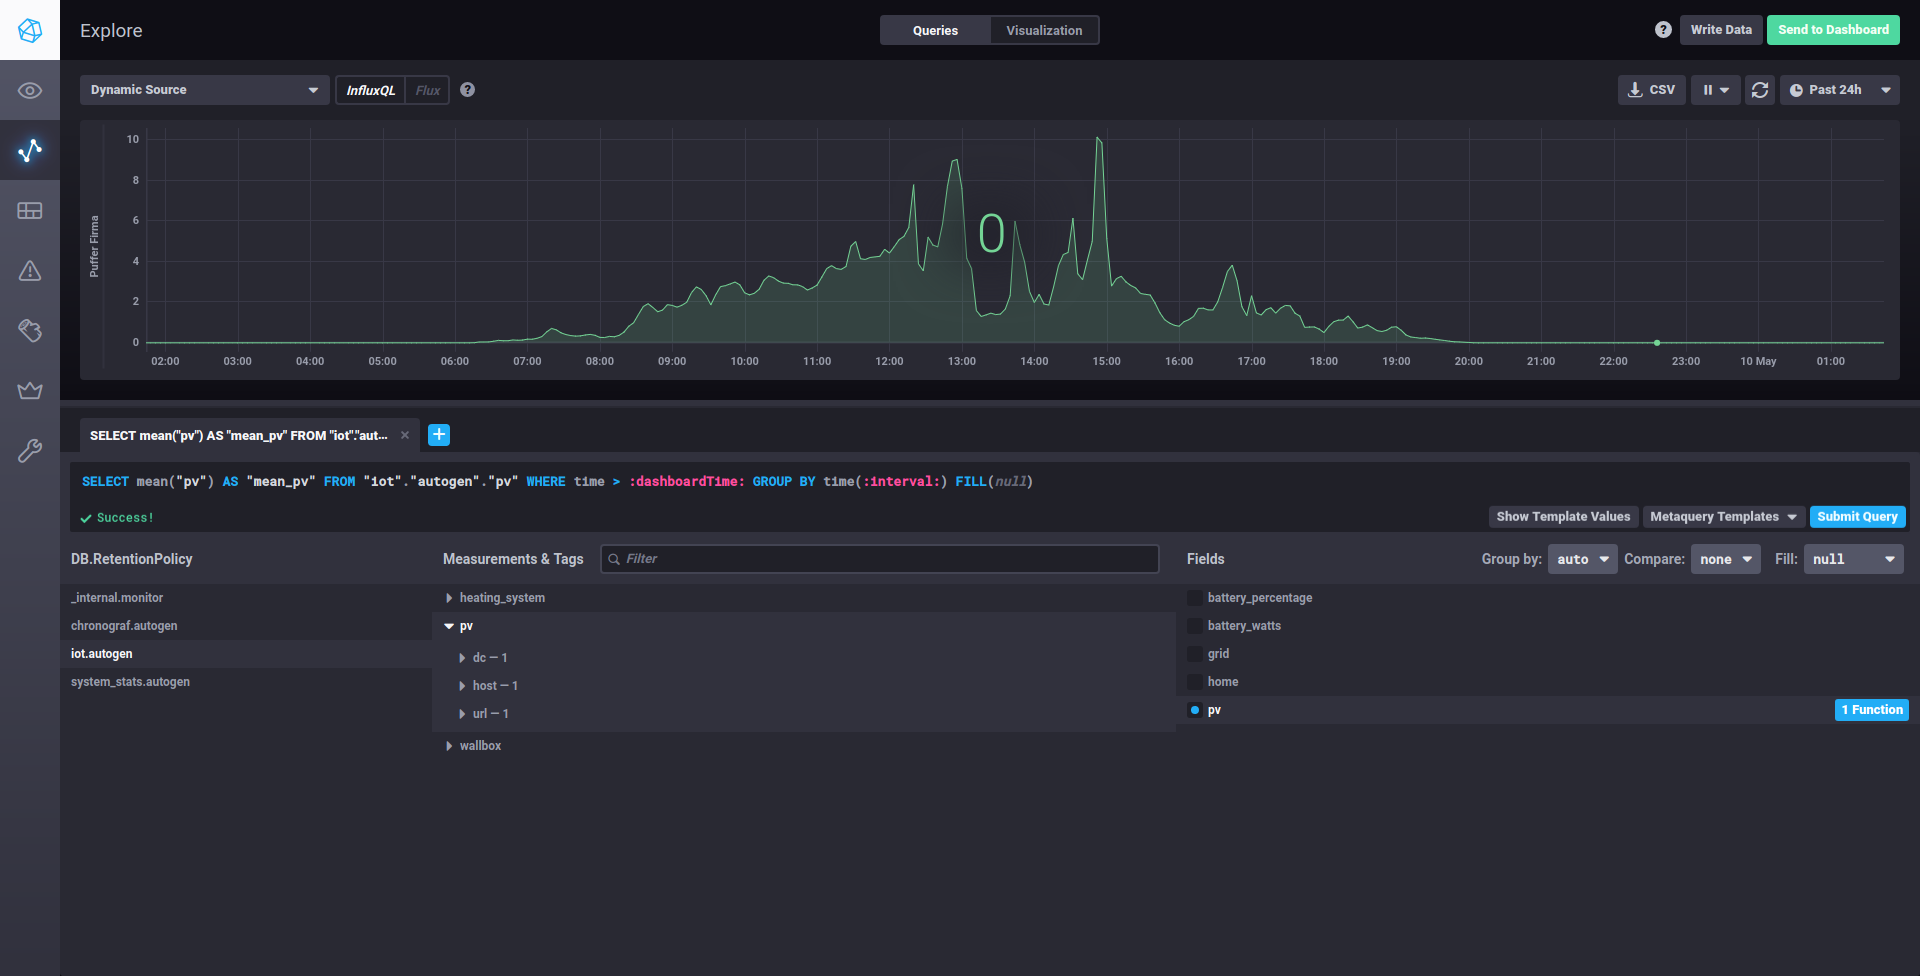
Chronograf should now display the juicy data we saved.